GoLand Nakama Multiplayer Plugin Dev Setup
Context and Info
As a small dev team I really wanted us to be able to streamline some of our (albeit basic) networking code. After some research I found the already pretty mature open source project Nakama. It checked a lot of the boxes: self hosted, extendable, open source. I’ve seen some complaints about scalability but they seem pretty inconsequential and I appreciate the level of detail the devs give in their responses to criticism. On top of all that they have a ready to go Godot 4 plugin with a ton of documentation.
Alright cool, fits the bill. Now we have a multiplayer solution with honestly more features than we’ll use. Our initial needs mostly revolve around using Nakama as a WebRTC signaling server but it doesn’t hurt to have online chat and matchmaking built in. So I threw a docker-compose file together and played around with the Godot plugin.
After a little playing around with matchmaking, I found my first hiccup. Despite names having what seems like an argument to include a “match name” in the create_match_async function - the actual match object in the DB didn’t seem to have a name column and I couldn’t find a table that would have matched names to match IDs. Okay, that’s all good - this is kind of a case by case functionality anyway so that makes sense out of the box. One of the reasons I picked Nakama was to have the ability to extend it - which I can through the multiple plugin runtimes they provide! I decided to go with the Golang runtime since its the only one that has established support for debugging.
Unfortunately, I was doing all this on a macOS M1 Max and the official Nakama docker images are all for intel architectures. I didn’t think this was as big a problem as it turned out to be since rosetta exists but know this: you will have a really annoying and obscure time coming to realize that using delve to debug any golang code inside an amd64 image hosted on an arm64 machine will not work. You’ll get some obscure error about nakama/nakama not being “implemented”. I can’t refind the buried stackoverflow answer that gave me my eureka moment but if I do I’ll come back here and update with a source.
So I jumped over to my amd64 PC and got to work setting up a multiplayer dev workstation. My goals were:
- Be able to iterate quickly
- Not have to abandon my IDE of choice (anything Jetbrains but in this case GoLand)
- Be able to have breakpoints in GoLand be recognized by my containerize Nakama instance
My final result looks something like this:
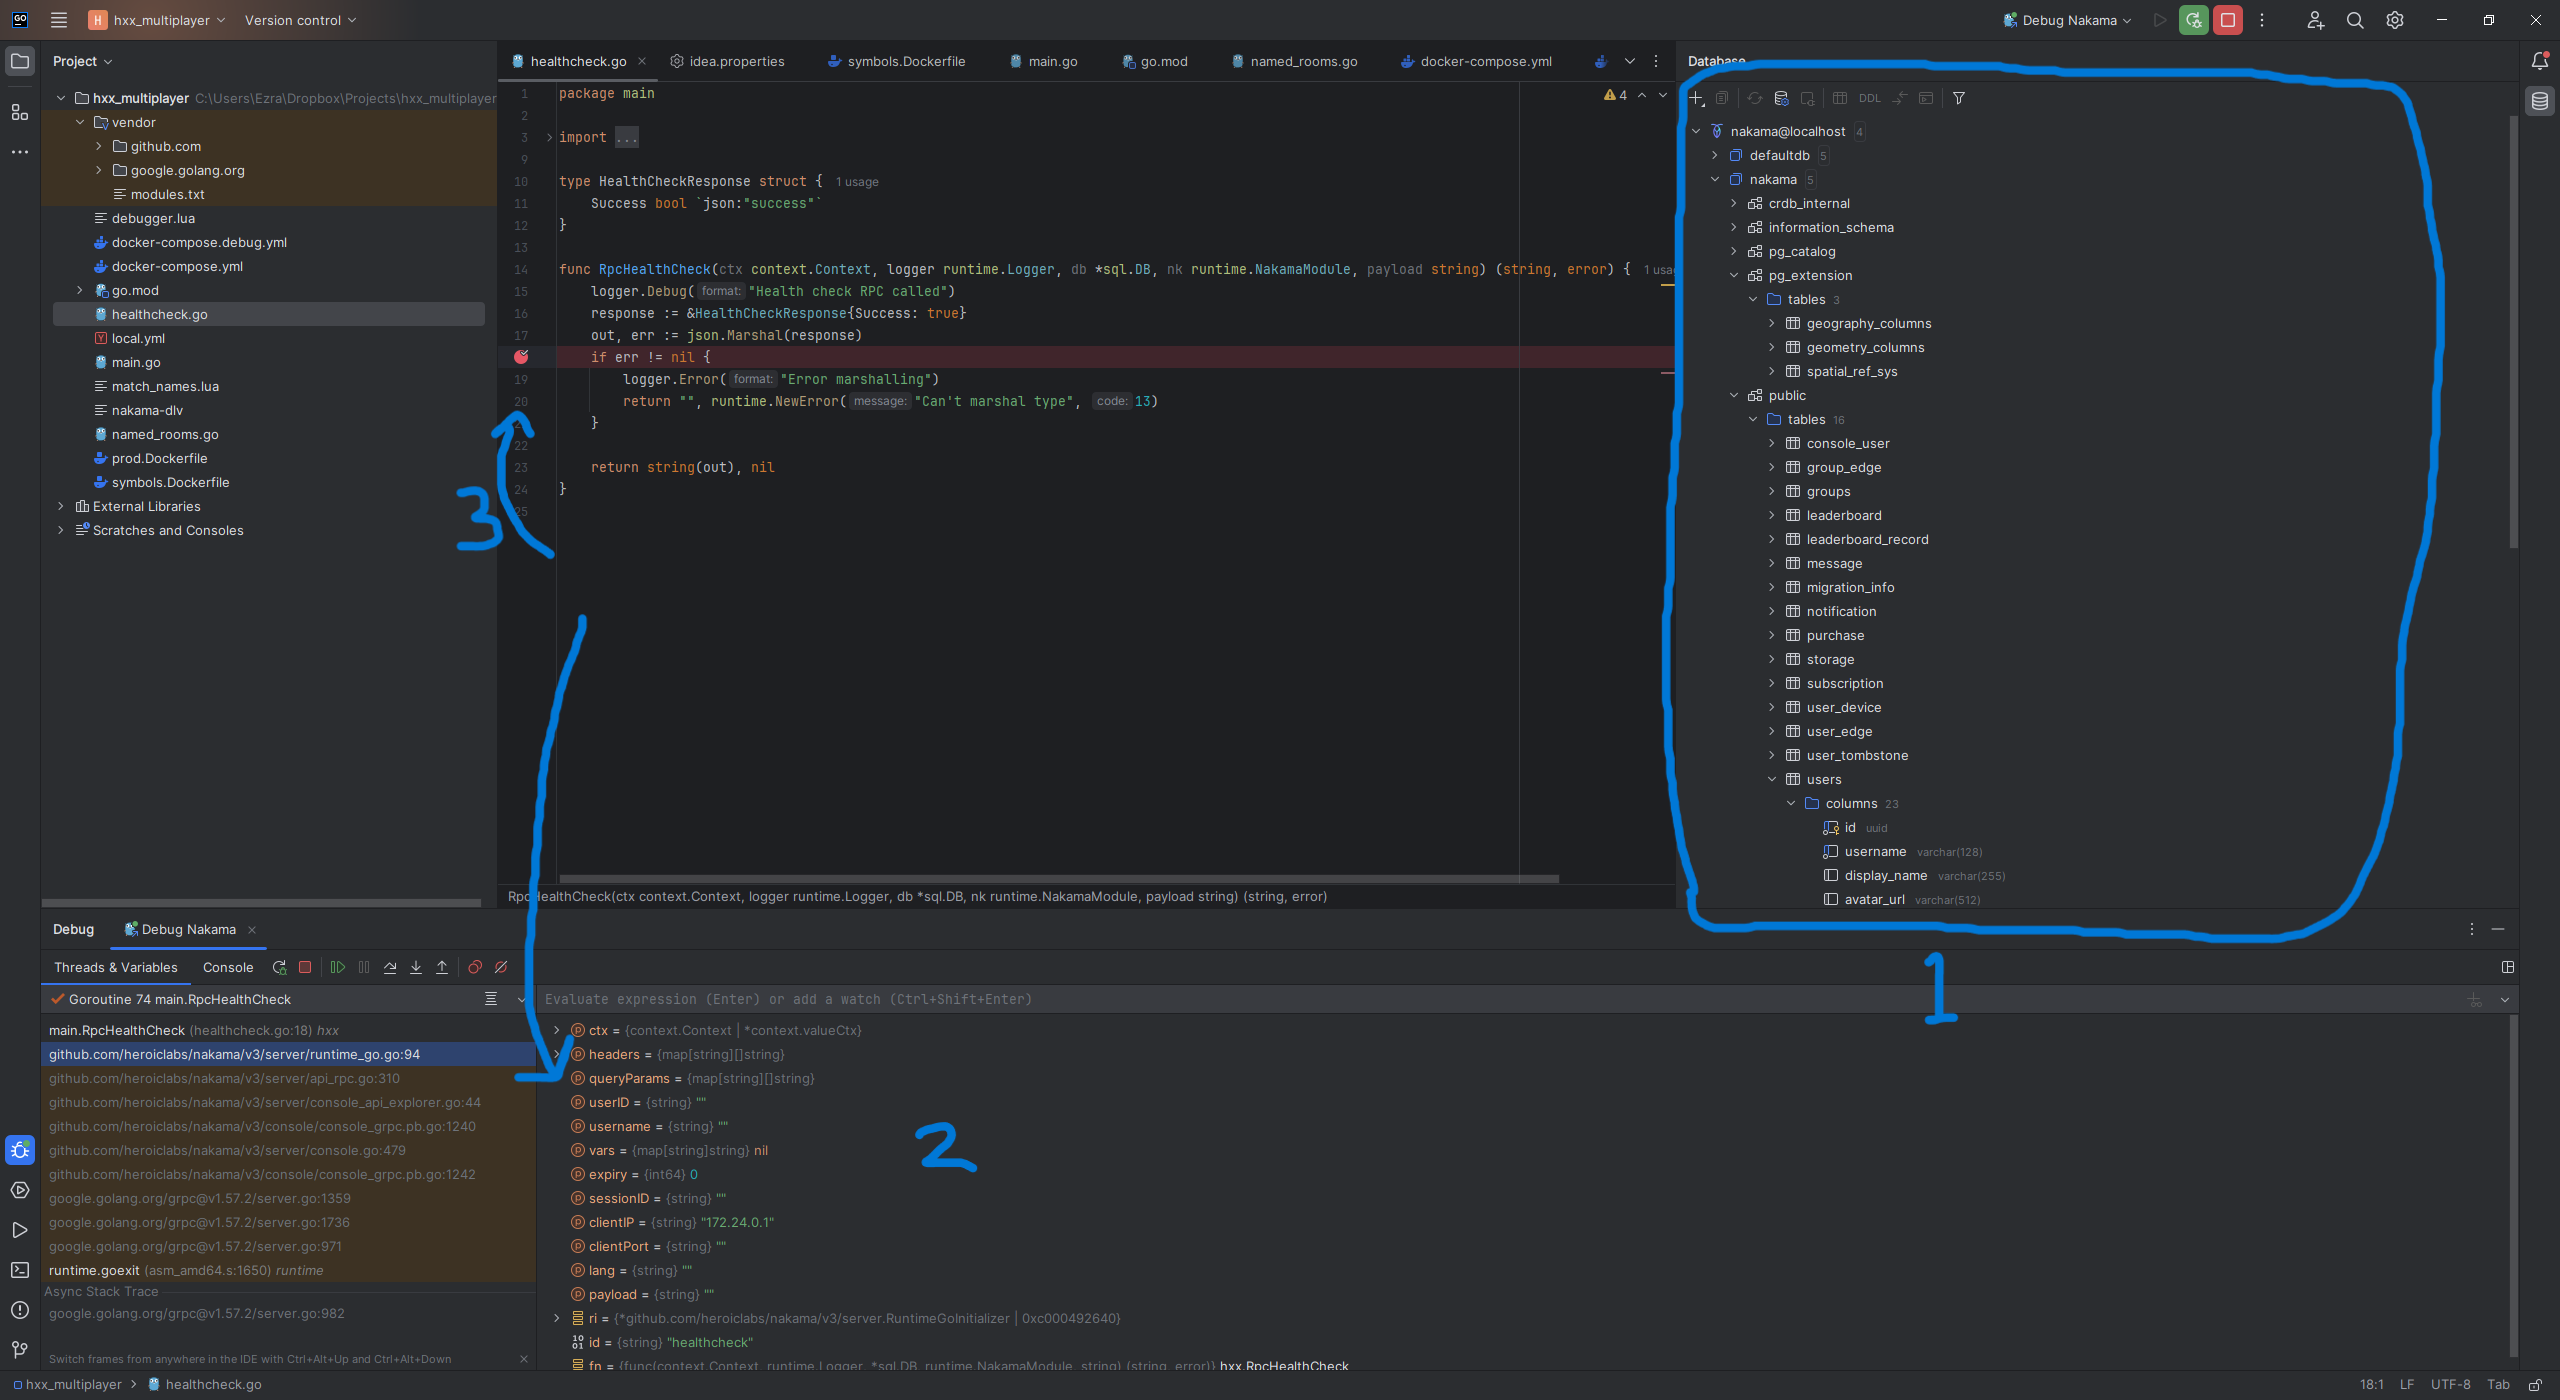
Where
- is the database view for the cockroach DB instance I have running in my docker compose setup
- is the context inspector for the breakpoint set at (3)
Technicals
The Docker part
The first thing we want to do is set up our docker compose. I linked above the official documentation for setting up delve with Nakama which provides a pretty handy Dockerfile and docker-compose.yml. It almost got the job done but here’s some slightly altered versions
symbols.Dockerfile:
FROM registry.heroiclabs.com/heroiclabs/nakama-pluginbuilder:3.19.0 AS go-builder
ENV GO111MODULE on
ENV CGO_ENABLED 1
WORKDIR /backend
COPY go.mod .
COPY vendor/ vendor/
COPY *.go ./

RUN apt-get update && \
    apt-get -y upgrade && \
    apt-get install -y --no-install-recommends gcc libc6-dev

RUN go build --trimpath --gcflags "all=-N -l" --mod=vendor --buildmode=plugin -o ./backend.so
RUN go install github.com/go-delve/delve/cmd/dlv@latest

FROM heroiclabs/nakama-dsym:3.19.0

COPY --from=go-builder /go/bin/dlv /nakama
COPY --from=go-builder /backend/backend.so /nakama/data/modules/
COPY local.yml /nakama/data/
COPY nakama-dlv /usr/bin

ENTRYPOINT ["tail", "-f"]
The symbols.Dockerfile just builds us an image in the same vein as the tutorial linked above. The only differences I believe are that I updated the version numbers to match the most up to date version at the time of writing and also changed the entrypoint to be tail -f. The reason I did that is so that I could more easily hop into the container to debug if need be by keeping it running - I know I could have done that by interactively jumping into a layer but I forgot the command for that and this felt simpler at the time. It’s not really necessary if everything is working.
docker-compose.debug.yml:
version: '3'
services:
  cockroachdb-debug:
    image: cockroachdb/cockroach:latest-v23.1
    command: start-single-node --insecure --store=attrs=ssd,path=/var/lib/cockroach/
    restart: "no"
    volumes:
      - data:/var/lib/cockroach
    expose:
      - "8080"
      - "26257"
    ports:
      - "26257:26257"
      - "8080:8080"
    healthcheck:
      test: ["CMD", "curl", "-f", "http://localhost:8080/health?ready=1"]
      interval: 3s
      timeout: 3s
      retries: 5
  nakama-debug:
    build:
      context: .
      dockerfile: symbols.Dockerfile
    entrypoint:
      - "/bin/sh"
      - "-ecx"
      - >
        nakama-dlv
    restart: "no"
    security_opt:
      - apparmor=unconfined
    cap_add:
      - SYS_PTRACE
    links:
      - "cockroachdb-debug:db"
    depends_on:
      cockroachdb-debug:
        condition: service_healthy
      prometheus-debug:
        condition: service_started
    expose:
      - "7349"
      - "7350"
      - "7351"
      - "9100"
      - "2345"
    ports:
      - "7349:7349"
      - "7350:7350"
      - "7351:7351"
      - "2345:2345"
    healthcheck:
      test: ["CMD", "/nakama/nakama", "healthcheck"]
      interval: 10s
      timeout: 5s
      retries: 5
  prometheus-debug:
    image: prom/prometheus
    entrypoint: /bin/sh -c
    command: |
      'sh -s <<EOF
        cat > ./prometheus.yml <<EON
      global:
        scrape_interval:     15s
        evaluation_interval: 15s

      scrape_configs:
        - job_name: prometheus
          static_configs:
          - targets: ['localhost:9090']

        - job_name: nakama
          metrics_path: /
          static_configs:
          - targets: ['nakama:9100']
      EON
      prometheus --config.file=./prometheus.yml
      EOF'
    ports:
      - '9090:9090'
volumes:
  data:
nakama-dlv:
#/bin/sh

/nakama/nakama migrate up --database.address root@cockroachdb-debug:26257
./dlv --listen=:2345 --headless=true --api-version=2 --accept-multiclient --log --log-output=debugger exec /nakama/nakama -- --config /nakama/data/local.yml --database.address root@cockroachdb-debug:26257/nakama
I labeled everything with the -debug suffix because this is one of two docker-compose files I have. These containers are built with nakama symbols for debugging and they include nakama-dlv - a custom script I wrote as an easy entrypoint for our composition. It just spins up the debugger headlessly.
The GoLand part
That was really the hard part to piece together. Once I got it all up and running in such a way that I could dlv inside the container properly, setting up GoLand was a matter of sifting through some disparate conversations online. In particular this one was helpful - the final post has a gif showing a weird workaround for a common issue. Coupled with this official doc and this old youtrack conversation I downloaded the newest delve via go install github.com/go-delve/delve/cmd/dlv@latest and set my GoLand properties as explained in the highlighted comment on that youtrack thread.
Following the official docs basically worked - except I was still getting this little symbol on my breakpoints which I can only assume means they aren’t working:

Whenever that came up though I just hit the restart debugger button in GoLand, and said “No” when it asked me if I wanted to stop the attached process in the container. That made the annoying symbol go away and I got this beautiful little checkmark symbol instead.

Conclusion
Anyway, it’s not much but its the small victories that matter. Now I can quickly iterate on and properly debug our multiplayer server without feeling like I’m throwing darts in the dark. Hopefully it helps and let me know if there’s anything I’m overthinking that would make this setup simpler!
Leave a comment
Log in with itch.io to leave a comment.